
Speed-time graphs
1) The area under a speed-time graph represents the distance travelled.
2) The gradient of a speed-time graph is the acceleration or deceleration.
Example: A particle is initially travelling at a speed of 2 m s-1 and immediately accelerates at
3 m s-2 for 10 seconds; it then travels at a constant speed before decelerating at a 2 m s-2
until it stops.
(a) Find the maximum speed and the time spent decelerating.
(b) Sketch a speed-time graph.
(c) If the total distance travelled is 1130 metres, find the time spent travelling at a constant
speed.
Solution:
(a) For maximum speed: u = 2, a = 3, t = 10, v = u + at >> v = 32 m s-1 is maximum speed.
For deceleration from 32 m s-1 at 2 m s-2 the time taken is 32 ÷ 2 = 16 seconds.
(b) In the graph, T is the total time taken.
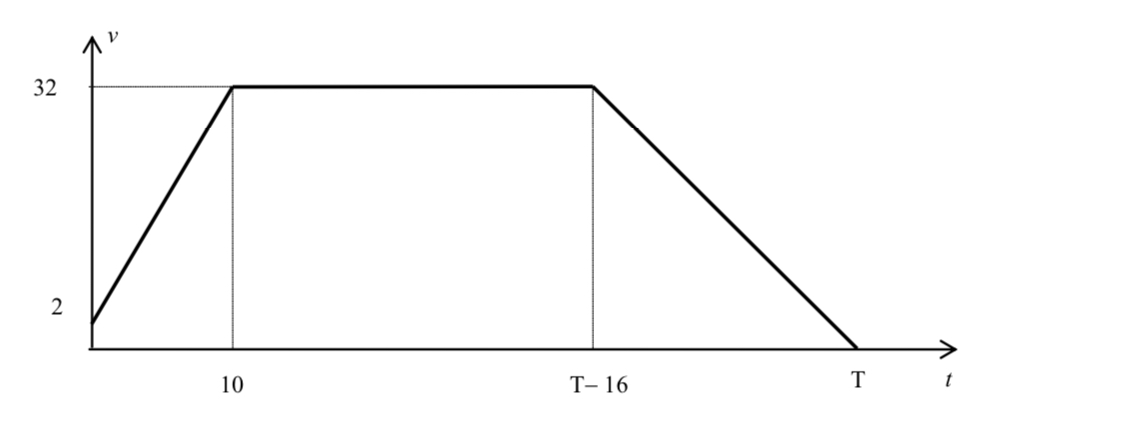
Distance travelled in first 10 secs is area of trapezium = 1/2(2 + 32) x 10 = 170 metres,
distance travelled in last 16 secs is area of triangle = 1/2 x 16 x 32 = 256 metres,
Total distance travelled is 1130 metres
-> distance travelled at constant speed = 1130 - (170 + 256) = 704 metres
-> time travelling at speed of 32 m s-1 is 704 ÷ 32 = 22 s.