
Acceleration-Time Graph
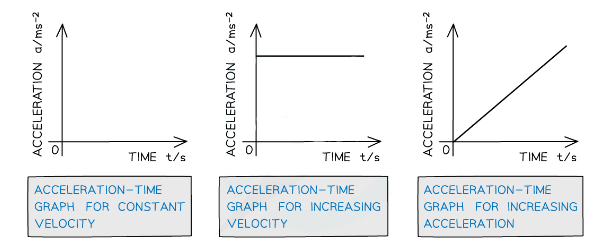
- On an acceleration-time graph…
- Slope is meaningless
- The y-intercept equals the initial acceleration
- A zero slope (horizontal line) represents an object undergoing constant acceleration
- The area under the curve equals the change in velocity
- Acceleration is defined as the rate of change of velocity
- In other words, it describes how much an object's velocity changes every second
- The equation below is used to calculate the average acceleration of an object:


- Where:
- a = acceleration in metres per second squared (m s–2)
- Δv = change in velocity in metres per second (m s–1)
- t = time taken in seconds (s)
- The change in velocity is found by the difference between the initial and final velocity, as written below:
change in velocity = final velocity − initial velocity