
Use an oscilloscope or data logger to display and analyse the potential difference (p.d.) across a capacitor as it charges and discharges through a resistor
Equipment
- Electrolytic capacitor
- Non-electrolytic capacitor
- Resistors
- Multimeter
- Power supply
- Two-way switch
- Oscilloscope
- Stop clock
- Signal generator
Method (Time Constant):
1. Record the value of the resistor, R using the multimeter, and the emf of the battery
using the oscilloscope.
2. Set up the below circuit using 100µF capacitor and a 470kΩ resistor.
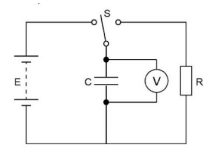
3. Switch the switch to the position shown in the diagram so that the capacitor charges up, and record the potential difference, V₀.
4. Switch the switch to the opposite position and start the stop clock.
5. Use the lap function and record the time it takes for the voltage to drop by 0.5V until
the capacitor has fully discharged.
Calculations
- Plot a graph of voltage against time for the discharging of the capacitor, and use it to determine the time constant of the capacitor.
- The capacitance of the capacitor can then be worked out using:
- Capacitance = Time Constant/Resistance
- The resistance in this case is 470x10³Ω
Method (Changing Resistance):
1. Set the square wave supply to produce a 50Hz 3V wave and attach it to the oscilloscope - adjust the controls as necessary so the waveform is clear.
2. Leave the settings as they are, and disconnect the supply from the oscilloscope.
3. Connect the supply in series with a 5µF capacitor and 1.2kΩ resistor and then attach the oscilloscope across the resistor so it reads the potential difference.
4. Sketch the trace with voltage and time scales.
5. Switch off the square wave supply and replace the resistor with a 470Ω on - turn the supply back on and sketch the new trace.
6. Repeat this process with a 2.2kΩ resistor
Safety Precautions
- Ensure you don’t use a supply voltage greater than the voltage rating of the capacitor.
- Disconnect the supply when not taking measurements to reduce the likelihood of the components overheating.
How to Read an Oscilloscope
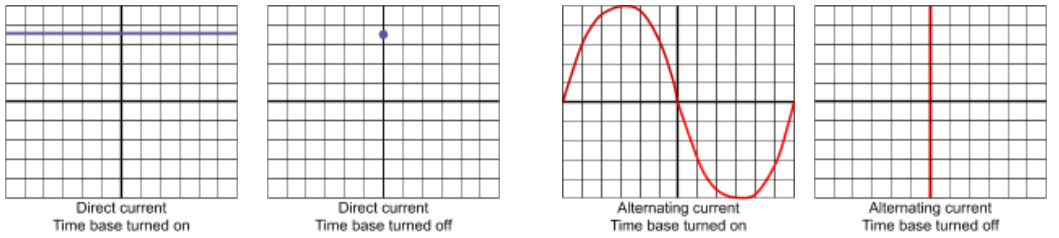
Oscilloscopes show the variation of voltage with time, however it is possible to turn off
the time-base, which will cause the trace to show all the possible voltages at any time
in one area, this is useful for taking measurements. For a direct current, the trace will
show a straight line parallel to the axis, at the height of the output voltage. If the time-base
is turned off, then only a dot will be seen on the screen, at the height of the output voltage.
For an alternating current, the trace will show a repeating sinusoidal waveform which
shows the variation of output voltage with time. If the time-base is switched off, then a
straight vertical line will appear on the screen, showing all the possible voltages.
In order to take measurements from an oscilloscope count the number of divisions
(adjusting the axes to make this easier), and multiply them by either the volts per division
or the time base, depending on what you are measuring:
1. Time period (T) - distance from one point on a curve e.g its peak, to the point where the curve repeats, in this example when it reaches the next peak. You can find the frequency of the waveform by using the formula:
![]()
2. Amplitude - distance from the equilibrium to the highest (or lowest) point.